Topic 1 of 5
#Use the Dashboard as a starting point
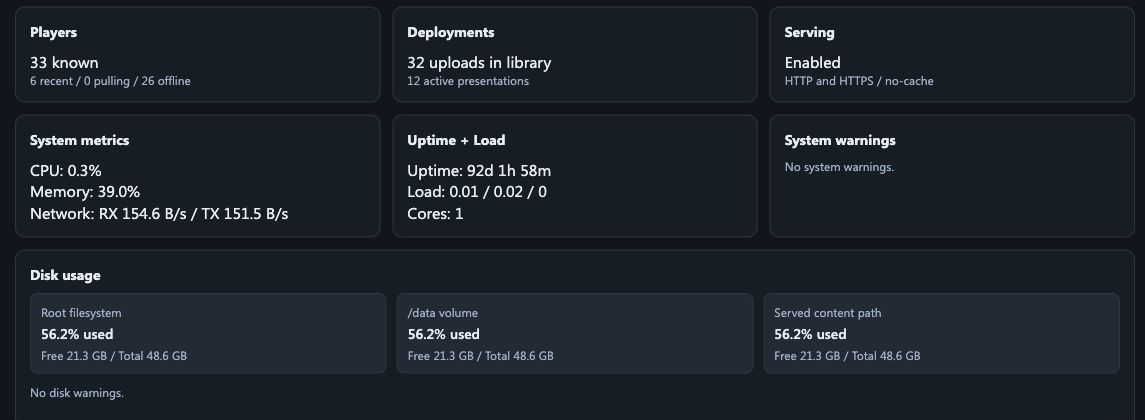
Click-by-clickThe 60-second dashboard check
Dashboard
- 1Config loaded
This should be healthy. If it is not, stop and report it.
- 2Serving enabled
This should be healthy. If it is disabled unexpectedly, stop and report it.
- 3Players
Look for a count that is different from the expected venue, project or installation state.
- 4System warnings
Read the exact warning. The words matter more than the colour.
- 5Disk usage
Check for a low-space warning before uploading or releasing large content.
The Dashboard is a summary, not the final diagnosis. Use it to decide where to look next, then open the relevant player, job or presentation for detail.
Topic 2 of 5
#Fleet cards
| Card | What to check |
|---|---|
| Total players | Whether the visible fleet size is expected |
| Online or recent | Players with fresh activity |
| Overdue | Players that have not reported within the expected window |
| Offline | Players needing schedule context or investigation |
| Unknown | Players without enough activity information |
Topic 3 of 5
#Recent activity and jobs
- Open failed or partial work before starting another fleet-wide action.
- A completed release still needs player-side verification.
- Repeated warnings on the same player usually deserve targeted investigation.
- Use timestamps to distinguish a current incident from old history.
Topic 4 of 5
#Storage indicators
Low available storage can interrupt uploads, content preparation or backups. If the Dashboard shows a storage warning, pause large content changes and ask an authorised maintainer to review retained material.
Topic 5 of 5
#Choose the next action
| Observation | Next workspace |
|---|---|
| Unexpected offline player | Players → player detail |
| Failed content release | Deployment → job result |
| Presentation upload problem | Presentation library |
| Poor connection test | Utility Tools |
| Several screens need visual checking | Multiview |